

Better or Worse
Better or Worse
Are the Isles under or over-achieving so far?

Ready to start Holiday Shopping? You can get 10% off Vintage Ice Hockey apparel by using promo code “Isles Fix” at check-out. Later this month, one paid subscriber will choose a $75 gift card or an in-stock jersey.

Free shipping off all US orders; shop VintageIceHockey.com

Good Morning, Islanders Country.
The Isles are sitting at 8-6-6 through 20 games, and a relatively strong case can be made that their point total could or should be better given the amount of multi-goal leads they’ve surrendered and their challenges with scoring in overtime and winning in the shootout.
So why do these charts say the Isles should be even worse?
J Fresh Hockey shared a couple of graphics on Monday; one shows the Islanders playing at a 90-point pace, outperforming their expected pace based on their share of scoring chances. The other shows just how many points they would end with based on having league-averaging finishing and goaltending.
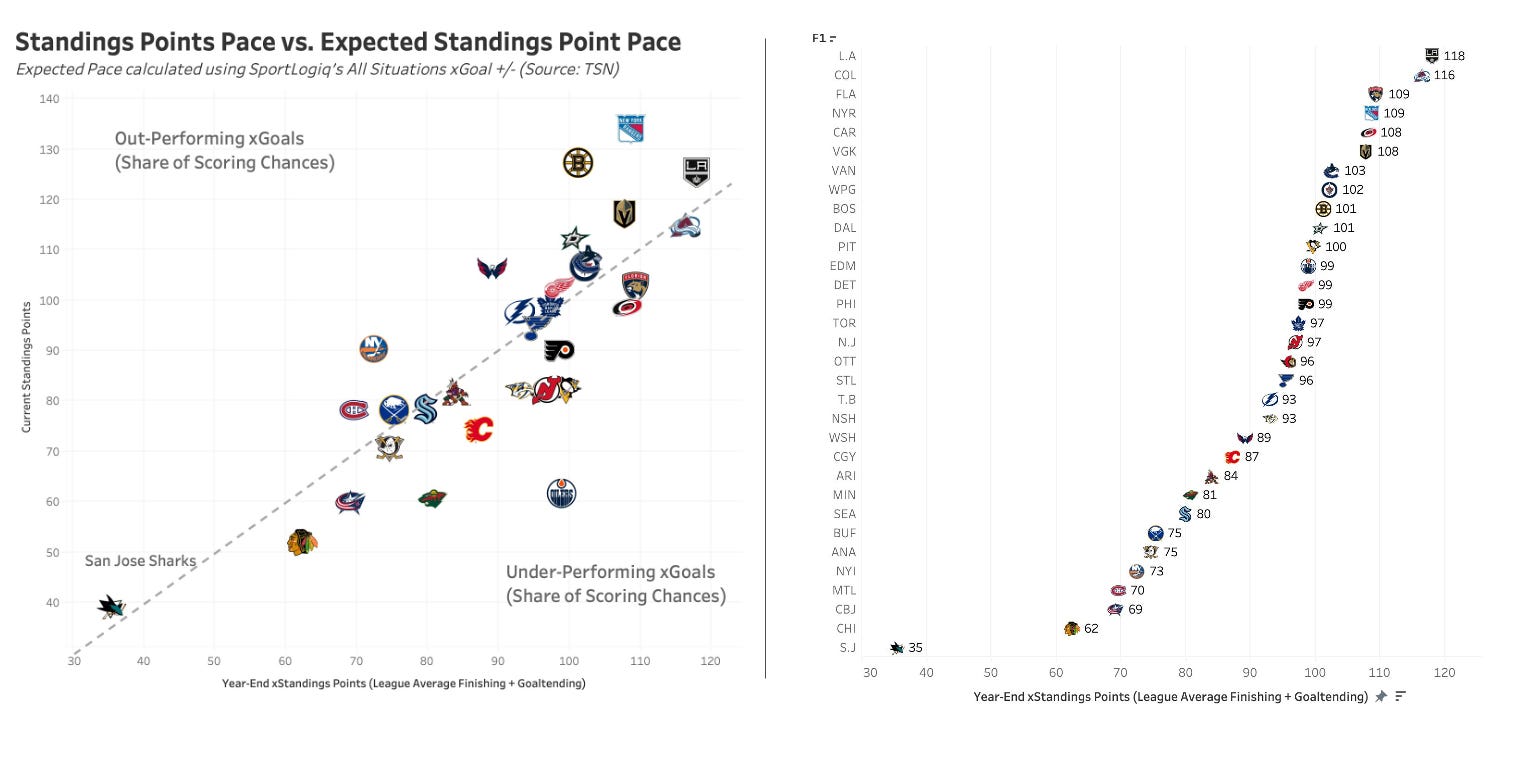
If it takes you a while to find the Islanders logo, I understand. It’s way down towards the bottom at 73, yes, SEVENTY-THREE points. Now, before you say how ridiculous that is, he also shared how the projections looked at this time last year, and it had the Isles at 90 points. They finished with 93.
The Islanders win in ways that go against the norm and have been doing it for years. There’s probably no team that has defied the models more than them, but these projections emphasize their reliance on their goaltending and making the most of their limited opportunities. In a league with so much parity where the margin of error is thin each night, it often feels like the Isles have the smallest.
After one-quarter of the season, it’s hard to say whether they should be better or worse than they are. Perhaps the next 20 will tell us the answer, as the second quarter starts tonight in Newark vs. the New Jersey Devils.
Keep reading with a 7-day free trial
Subscribe to Isles Fix to keep reading this post and get 7 days of free access to the full post archives.